Published page
Northern lights forecast


A Northern lights forecast, or auroral activity prediction, refers to the scientific modeling and estimation of the probability, intensity, and geographical extent of auroral disp…
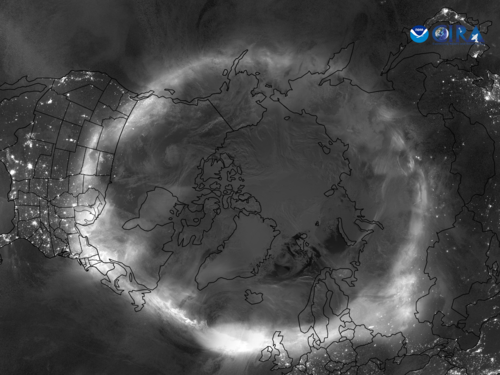
Northern lights forecast
A Northern lights forecast, or auroral activity prediction, refers to the scientific modeling and estimation of the probability, intensity, and geographical extent of auroral disp…
NOAA · Public domain · Northern Lights From Over the North Pole (NESDIS 2024-05-15 nhem-aurora-labels).png
A Northern lights forecast, or auroral activity prediction, refers to the scientific modeling and estimation of the probability, intensity, and geographical extent of auroral displays based on real-time solar wind data and space weather observations.
1. Overview
The aurora borealis (commonly known as the Northern Lights) is a natural light display in the Earth's sky, predominantly seen in high-latitude regions around the Arctic. While historically viewed as unpredictable atmospheric phenomena, modern space physics enables scientists to forecast these displays with reasonable accuracy.
An auroral forecast operates much like terrestrial weather forecasting, but instead of tracking clouds and atmospheric pressure, it monitors solar emissions, interplanetary magnetic fields, and geomagnetic disturbances in Earth's magnetosphere. These forecasts are essential not only for auroral photographers and tourists seeking to view the phenomenon, but also for power grid operators, satellite controllers, and aviation planners who must mitigate the effects of geomagnetic storms.[1]During extreme space weather, induced currents in power grids can cause severe blackout events, as occurred during the 1989 Quebec solar storm.
2. Scientific Principles
The generation of an aurora begins at the Sun. The solar atmosphere continuously emits a stream of charged particles known as the solar wind. Periodically, the Sun experiences explosive events such as solar flares or Coronal Mass Ejections (CMEs), releasing massive clouds of plasma carrying strong magnetic fields into interplanetary space.
When these high-energy solar particles travel toward Earth, they interact with the Earth's magnetic field (magnetosphere). If the magnetic field carried by the solar wind aligns oppositely to Earth's magnetic field—specifically when the Interplanetary Magnetic Field (IMF) points southward ($B_z < 0$)—magnetic reconnection occurs. This allows the solar particles to enter the upper atmosphere along Earth's magnetic field lines, colliding with oxygen and nitrogen atoms in the thermosphere and causing them to glow.[2]Excited oxygen atoms emit green light around 100 to 300 kilometers altitude, while rare crimson red auroras occur higher up above 300 kilometers.
Predicting auroral activity thus relies on measuring the properties of the solar wind before it hits Earth's magnetosphere, as well as tracking the solar activity that produces these solar wind variations.
3. Key Measurement Indices
To provide an easily understandable metric for auroral potential, space weather agencies utilize several specialized indices:
- Kp Index (Planetary K-index): The most widely recognized metric for auroral visibility. The Kp index is a scale from 0 to 9 used to quantify geomagnetic activity. A low value (0 to 2) indicates quiet geomagnetic conditions, where auroras are confined to high-latitude polar regions. Higher values (5 to 9) represent geomagnetic storms, during which the auroral oval expands significantly toward lower latitudes (mid-latitudes).
- Solar Wind Speed and Density: Measured in kilometers per second (km/s) and particles per cubic centimeter ($\text{p/cm}^3$), respectively. Baseline solar wind speeds typically hover around 300 to 400 km/s, but high-speed streams from coronal holes or CMEs can exceed 700 to 1000 km/s, dramatically increasing auroral potential.
- Interplanetary Magnetic Field ($B_z$): The vertical orientation of the IMF magnetic vector. A strongly negative (southward) $B_z$ value acts as a "key" that unlocks Earth's magnetosphere, allowing solar wind energy to transfer efficiently into the atmosphere.
4. Forecasting Techniques and Lead Times
Auroral forecasting operates across different timeframes depending on the observation source used:
- Long-range Forecasts (27 Days): Based on the Sun's rotational period of approximately 27 days. Scientists track recurring structures on the solar surface, such as coronal holes, to predict when high-speed solar wind streams will face Earth again.
- Medium-range Forecasts (1 to 3 Days): Enabled by solar observation satellites (such as SOHO and SDO) monitoring the solar disk. When a CME is detected leaving the Sun, coronagraph imagery allows scientists to estimate its speed, trajectory, and expected time of arrival at Earth.
- Short-range / Real-time Forecasts (30 to 90 Minutes): Provided by spacecraft stationed at the Sun-Earth Lagrange Point 1 (L1), situated about 1.5 million kilometers upstream from Earth (such as the DSCOVR and ACE satellites).[3]Satellites stationed at L1 orbit a gravitational equilibrium point, allowing continuous solar wind sampling prior to Earth arrival. Sensors at L1 measure the actual solar wind speed, density, and magnetic direction, giving an accurate final warning before the solar wind impacts Earth.
5. Major Forecasting Organizations
Several international scientific institutes provide public auroral and space weather predictions:
- NOAA Space Weather Prediction Center (SWPC): Operated by the United States government, the SWPC provides global space weather alerts and maintains the OVATION prime model, which generates 30-minute short-term aurora maps showing the probability of visibility.
- Space Weather Canada: Operates specialized geomagnetic monitoring networks across northern latitudes, tailored specifically for Canadian territory.
- European Space Agency (ESA) Space Weather Office: Provides localized monitoring and modeling services for European nations, particularly Scandinavia.
6. Limitations of Auroral Forecasting
Despite significant advances in satellite technology, auroral forecasting remains an imperfect science. A primary challenge is determining the exact magnetic field orientation ($B_z$) of a Coronal Mass Ejection before it reaches the L1 satellite. If a massive CME strikes Earth but its magnetic field points northward ($B_z > 0$), the resulting auroral display may be surprisingly weak.
Additionally, localized atmospheric conditions—such as tropospheric cloud cover—often prevent observers on the ground from seeing an aurora even when geomagnetic conditions are optimal.
7. Trivia
7.1 Geomagnetic Activity Index (Kp Index)
The primary metric utilized in modern auroral forecasting is the Kp index, a standardized scale ranging from 0 to 9 used to quantify geomagnetic activity. Developed by Julius Bartels in 1949, the index is derived from magnetometer readings taken at mid-latitude observatories around the globe over three-hour intervals.[4]Julius Bartels introduced the planetary K-index in 1949 to standardize geomagnetic disturbance measurements on a logarithmic scale. A Kp value of 0 to 2 indicates minimal solar particle intrusion, generally confining visibility to polar latitudes. Conversely, extreme geomagnetic storms registering a Kp of 8 or 9 can push the auroral oval toward lower mid-latitudes, rendering the phenomenon visible in regions such as southern Europe or the central United States.
7.2 Solar Wind Hydrodynamics and Space Weather Observatories
Real-time short-term auroral forecasting relies heavily on deep-space satellites positioned at the Lagrange point 1 (L1), approximately 1.5 million kilometers upstream from Earth toward the Sun. Spacecraft such as the Deep Space Climate Observatory (DSCOVR) and the Advanced Composition Explorer (ACE) measure the velocity, density, and magnetic field orientation of the incoming solar wind. Because these satellites detect solar particles roughly 15 to 60 minutes before they impact Earth's magnetosphere, they provide the final buffer for high-precision, short-term warnings (often referred to as 30-minute advance forecasts).
7.3 Interplanetary Magnetic Field $B_z$ Component Orientation
A critical vector in predictive algorithms is the $B_z$ component of the Interplanetary Magnetic Field (IMF). The IMF's orientation along the Earth's north-south magnetic axis determines the efficiency of energy transfer into the magnetosphere. When the $B_z$ vector points southward (negative values), it aligns oppositely to Earth's intrinsic magnetic field. This configuration induces magnetic reconnection, causing Earth's magnetic shield to open and allowing charged solar particles to cascade into the upper atmosphere. Consequently, a high solar wind speed paired with a strongly negative $B_z$ is the prerequisite for major auroral displays, regardless of the baseline solar flare strength.
7.4 Photometric Limitations and Human Visual Perception Divergence
A frequent discrepancy in auroral observation arises from the difference between digital sensor capture and human scotopic vision. Auroral forecasting models predict energy deposition and light emissions based on physical flux, but human rod cells are incapable of perceiving color under low-light conditions. As a result, weak auroral activity that appears as a faint, milky grey haze to the naked eye can be rendered as vibrant green or pink in long-exposure digital photographs.[5]Camera sensors accumulate photons over time, revealing vivid greens and purples that appear as washed-out white light to human rod cells. Accurate forecasting services often distinguish between visual visibility thresholds and photographic detection thresholds.
7.5 Atmospheric Refraction and Auroral Horizon Distance
Forecasting maps utilize the concept of the "viewing line" or "auroral horizon," which accounts for the altitude at which auroral light is generated—typically between 100 and 300 kilometers above Earth's surface. Because of this elevation, an aurora does not need to be directly overhead to be observed. Under clear atmospheric conditions, an observer standing at ground level can view an auroral display occurring over 1,000 kilometers away near the horizon. Predictive models incorporate this geometric offset to extend the geographical boundary of potential visibility south of the physical auroral oval.
7.6 Ionospheric Distortions and Satellite Telecommunication Disruptions
Beyond aesthetic predictions for stargazers, auroral forecasts serve an essential industrial purpose for global telecommunications and aviation operations. The intense localized ionization that produces bright auroras alters the total electron content (TEC) of the ionosphere. This variation causes radio signal scintillation, degrades High-Frequency (HF) radio communication, and introduces positional errors in Global Navigation Satellite Systems (GNSS). Commercial airlines transiting polar routes rely on space weather forecasts to reroute flights to lower latitudes when severe geomagnetic storms are predicted to sever satellite and radio communications.[6]https://www.faa.gov/air_traffic/publications/atpubs/aip_html/part2_enr_section_1.17.html — Polar flight routes are frequently diverted southward during solar storms to maintain essential high-frequency radio links.
Child documents of "Northern lights forecast"
None yet.