Published page
Pollen count


The pollen count is a standardized meteorological and biological metric that quantifies the concentration of airborne plant pollen grains present within a specific volume of o…
Pollen count
The pollen count is a standardized meteorological and biological metric that quantifies the concentration of airborne plant pollen grains present within a specific volume of o…
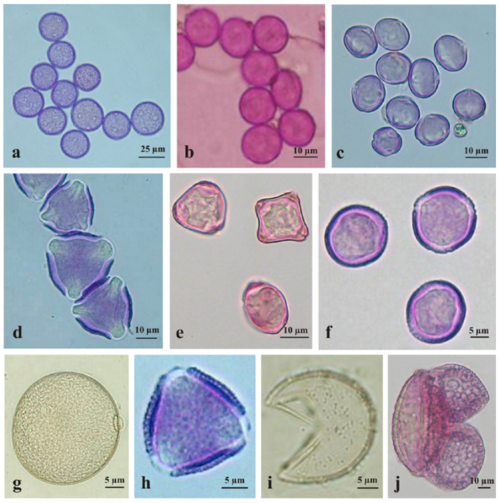
Denisow, B. and Weryszko-Chmielewska, E. Photo: Irene Câmara Camacho. · CC BY-SA 4.0 · Pollen grains observed in aeroplankton of South Europe.png
The pollen count is a standardized meteorological and biological metric that quantifies the concentration of airborne plant pollen grains present within a specific volume of outdoor air over a defined period.
Often reported in units of grains per cubic meter ($\text{grains/m}^3$), this measurement serves as a critical environmental indicator utilized by aerobiologists, meteorologists, and healthcare professionals to evaluate seasonal allergen exposure levels and predict public health impacts.
1. Overview and Purpose
Pollen grains are microscopic, male gametophytes released by seed plants—specifically trees, grasses, and weeds—as an essential phase of reproductive anemophilous (wind-driven) pollination. Due to their buoyancy and aerodynamic structures, these particles easily become suspended in the lower troposphere, where they can be transported across vast geographical distances.
For individuals suffering from allergic rhinitis (commonly known as hay fever), allergic conjunctivitis, or asthma, inhaled airborne pollen acts as a potent antigen. Exposure triggers an localized immune response characterized by the release of histamine, leading to symptoms such as sneezing, airway inflammation, and ocular irritation. The primary objective of monitoring pollen counts is to provide predictive data that allows susceptible populations to implement preventive medical interventions and limit outdoor exposure during peak concentration periods.
2. Methodology and Measurement Techniques
The process of determining a pollen count relies on aerobiological sampling techniques combined with manual microscopic analysis.
- Sampling Equipment
The most widely adopted instrument for volumetric air sampling is the Burkard volumetric spore trap (often referred to as a Hirst-type sporetrap). Positioned typically on elevated surfaces, such as building rooftops, to avoid localized airflow obstructions, the trap draws in ambient air at a constant rate—usually ten liters per minute, mimicking human respiration rates.[1]This airflow intake rate was explicitly calibrated to approximate the tidal volume and minute ventilation of a resting human adult.
- Particle Capture and Processing
As ambient air passes through a narrow intake orifice, airborne particles impact a slowly rotating drum or sliding glass slide coated with a viscous adhesive substance, such as petroleum jelly or silicone grease. Over a 24-hour cycle, the particles stick to the substrate, creating a chronological timeline of trapped matter.
- Microscopic Identification and Quantification
The collected sample is prepared on a slide, stained with specific dyes (such as basic fuchsin or Phenol Safranin) to highlight cellular structures, and examined under an optical light microscope. Qualified aerobiologists manually identify pollen grains based on distinct morphological characteristics, including size, shape, surface texture, and the number or structure of pores and furrows (apertures). The total number of identified grains is subsequently converted into a concentration value representing grains per cubic meter of air.
3. Influencing Environmental Factors
Airborne pollen dynamics are heavily dependent on local vegetation, plant phenology, and prevailing meteorological conditions.
- Diurnal and Seasonal Variations
Pollen emission operates on distinct biological cycles. Different plant taxa release pollen during specific windows throughout the year; for example, temperate tree pollen peaks during early spring, grasses dominate during late spring and summer, and weeds peak in late summer and autumn. On a daily basis, most plants release pollen during the early morning hours as ambient temperatures rise and relative humidity decreases.
- Weather Dynamics
- Temperature and Solar Radiation: Warm, sunny days stimulate plant maturation and accelerate the opening of anthers, releasing high volumes of pollen into the atmosphere.
- Wind Speed and Turbulence: Strong, dry winds facilitate the detachment of pollen grains from flowers and enhance their suspension and dispersal across long distances.
- Precipitation: Rain acts as a natural atmospheric scrubber. Precipitation binds to suspended pollen particles, weighing them down and effectively washing them out of the air, resulting in a sharp, temporary drop in pollen counts.
- Atmospheric Humidity: High relative humidity causes pollen grains to absorb moisture, increasing their mass and causing them to settle rapidly to the ground.
4. Categorization and Reporting Standards
To translate raw volumetric data into actionable information for the general public, standard index scales are employed. Institutions such as the National Allergy Bureau (NAB)—a section of the American Academy of Allergy, Asthma & Immunology (AAAAI)—classify counts into standardized categories.[2]The organization maintains a network of certified counting stations across the United States to standardize public reporting.
These classifications typically range from Low to Very High:
- Low: Pollen concentrations are minimal and only affect the most sensitive individuals.
- Moderate: Concentrations are sufficient to cause mild discomfort in individuals with established clinical allergies.
- High: Airborne levels are elevated; most people with allergic sensitivities will exhibit overt clinical symptoms.
- Very High: Pollen saturation is severe, causing intense symptoms in allergic individuals and potentially triggering reactions in non-sensitized populations.
Because thresholds vary by plant category (e.g., grass pollen triggers severe allergic reactions at much lower absolute concentrations than tree pollen), reporting scales apply distinct numeric ranges for trees, grasses, and weeds.
5. Limitations and Future Outlook
Despite its widespread application, traditional manual pollen counting possesses inherent limitations. Manual identification is labor-intensive, requiring specialized taxonomic expertise, which often creates a 24- to 48-hour lag between sample collection and public reporting. Furthermore, stationary sampling stations provide average regional readings that may not reflect localized micro-climates or immediate neighborhood exposure.
To address these challenges, modern aerobiology is transitioning toward automated real-time pollen monitoring systems. Technologies utilizing image-recognition algorithms, fluorescence spectroscopy, and flow cytometry are being integrated into smart environmental sensor networks. These advancements aim to deliver instantaneous, automated, and hyper-local pollen counts, significantly refining allergy forecasting models.
6. Trivia
6.1 The Anemophilous Floral Paradox
The vast majority of airborne pollen measured in official counts originates from anemophilous (wind-pollinated) flora rather than entomophilous (insect-pollinated) species. Brilliant, fragrant flowers such as roses or sunflowers contribute negligibly to atmospheric pollen densities because their pollen grains are heavy, sticky, and evolutionarily optimized for vector transport. Conversely, plain, inconspicuous plants—such as ragweed (*Ambrosia*), oak (*Quercus*), and various Poaceae species—release light, dry, aerodynamic pollen grains in staggering quantities. A single ragweed plant can discharge up to one billion pollen grains in a single season, driving atmospheric counts upward while remaining virtually invisible to the casual observer.[3]https://www.ncbi.nlm.nih.gov/pmc/articles/PMC7114674 — A single ragweed plant can produce up to a billion grains of pollen in a single season to maximize wind pollination success.
6.2 Burkard Volumetric Spore Sampling Methodology
Standardized international pollen counts do not rely on digital sensors or real-time automated optical devices; rather, they depend on the Burkard Volumetric Spore Trap, a mechanical device utilizing principles developed in the mid-20th century. The apparatus vacuums air at a continuous rate of 10 liters per minute—matching the average human respiration rate—and impacts airborne particulates onto a rotating clockwork drum coated with a viscous adhesive (typically Vaseline or silicone oil). Aerobiologists must manually retrieve this tape, stain it with basic fuchsin or phenosafranin dye, and physically count and classify individual pollen grains under a light microscope. Consequently, most officially reported "daily" pollen counts actually reflect atmospheric conditions from the preceding 24-hour period.
6.3 Rain-Induced Pollen Fragmentation Phenomenon
While moderate, sustained rainfall effectively cleanses the atmosphere by wet deposition—washing pollen grains to the ground—severe thunderstorms induce a dangerous counter-effect known as "thunderstorm asthma." High humidity and rapid osmotic pressure changes cause atmospheric pollen grains to absorb water, swell, and violently rupture into thousands of sub-micron starch granules. These micro-particles are small enough to bypass the upper respiratory tract's filtering mechanisms and penetrate deep into the lower pulmonary alveoli, causing severe, unexpected respiratory distress even in individuals who typically only suffer from mild upper-airway rhinitis.[4]The phenomenon was first formally documented following a sudden influx of emergency room visits during a 1987 storm in Melbourne, Australia.
6.4 Diurnal Atmospheric Convection Cycles
Pollen counts exhibit distinct micro-temporal fluctuations dictated by solar radiation and thermal convection currents. Plants typically dehisce (release pollen) in the early morning hours as temperatures rise and dew evaporates. However, surface pollen counts at ground level often peak in the late afternoon and early evening. This lag occurs because thermal updrafts carry the lightweight particles high into the troposphere during peak sunlight; as the earth cools in the late afternoon, the boundary layer collapses, and descending air currents deposit vast plumes of concentrated pollen back down to human height.
6.5 Paleopalynological Forensic Reconstructions
The outer shell of a pollen grain, known as the *exine*, is composed of sporopollenin—one of the most chemically inert and decay-resistant organic polymers known to science. Because sporopollenin resists strong acids, intense heat, and microbial degradation, fossilized pollen grains remain intact in sedimentary layers, peat bogs, and permafrost for hundreds of millions of years. Scientists analyze historical pollen counts from core samples (paleopalynology) to reconstruct prehistoric climate changes, trace the agricultural footprints of ancient civilizations, and solve cold-case homicides by matching localized pollen profiles on a suspect's clothing to specific crime scene micro-environments.[5]Palynological evidence gained famous public attention when pollen trapped in soil traces helped forensic scientists locate burial sites in Austrian criminal investigations.
6.6 The Urban Heat Island Botanical Amplification
Urban environments often register significantly higher pollen counts and extended allergen seasons compared to adjacent rural zones, despite having far less total biomass. This disparity stems from the Urban Heat Island (UHI) effect combined with elevated atmospheric carbon dioxide ($CO_2$) concentrations. Elevated urban temperatures simulate an elongated growing season, causing plants to bloom earlier and remain active longer. Furthermore, elevated $CO_2$ acts as a metabolic stimulant for species like ragweed, causing them to double their pollen output and synthesize higher concentrations of the specific allergenic proteins (such as Amb a 1) within each individual grain.
6.7 Aerobiological Long-Range Transboundary Transport
Pollen grains routinely travel hundreds to thousands of kilometers beyond their point of origin via jet streams and atmospheric boundary layer transport, distorting local pollen count representations. For example, pollen from Mediterranean olive trees (*Olea europaea*) is frequently detected in significant concentrations across Northern Europe, and birch pollen from Scandinavian forests routinely drifts across the Baltic Sea into regions where the trees do not natively grow.[6]https://www.ncbi.nlm.nih.gov/pmc/articles/PMC4005080 — Deserts and open seas frequently show high seasonal counts of airborne grains carried entirely by high-altitude atmospheric winds. This long-range transport can trigger severe allergic reactions in populations days before local flora has even begun its seasonal bloom.
Child documents of "Pollen count"
None yet.